The charger operation and recharge statistics can be closely monitored live or post charging with a Bluetooth enabled device (such as a mobile phone or tablet) using the VictronConnect app.
There are 3 different overview screens available (STATUS, GRAPH and HISTORY), each displaying different monitoring or historical data; spanning back over the last 40 charge cycles.
The desired screen can be selected by either selecting the window title or by swiping across between screens.
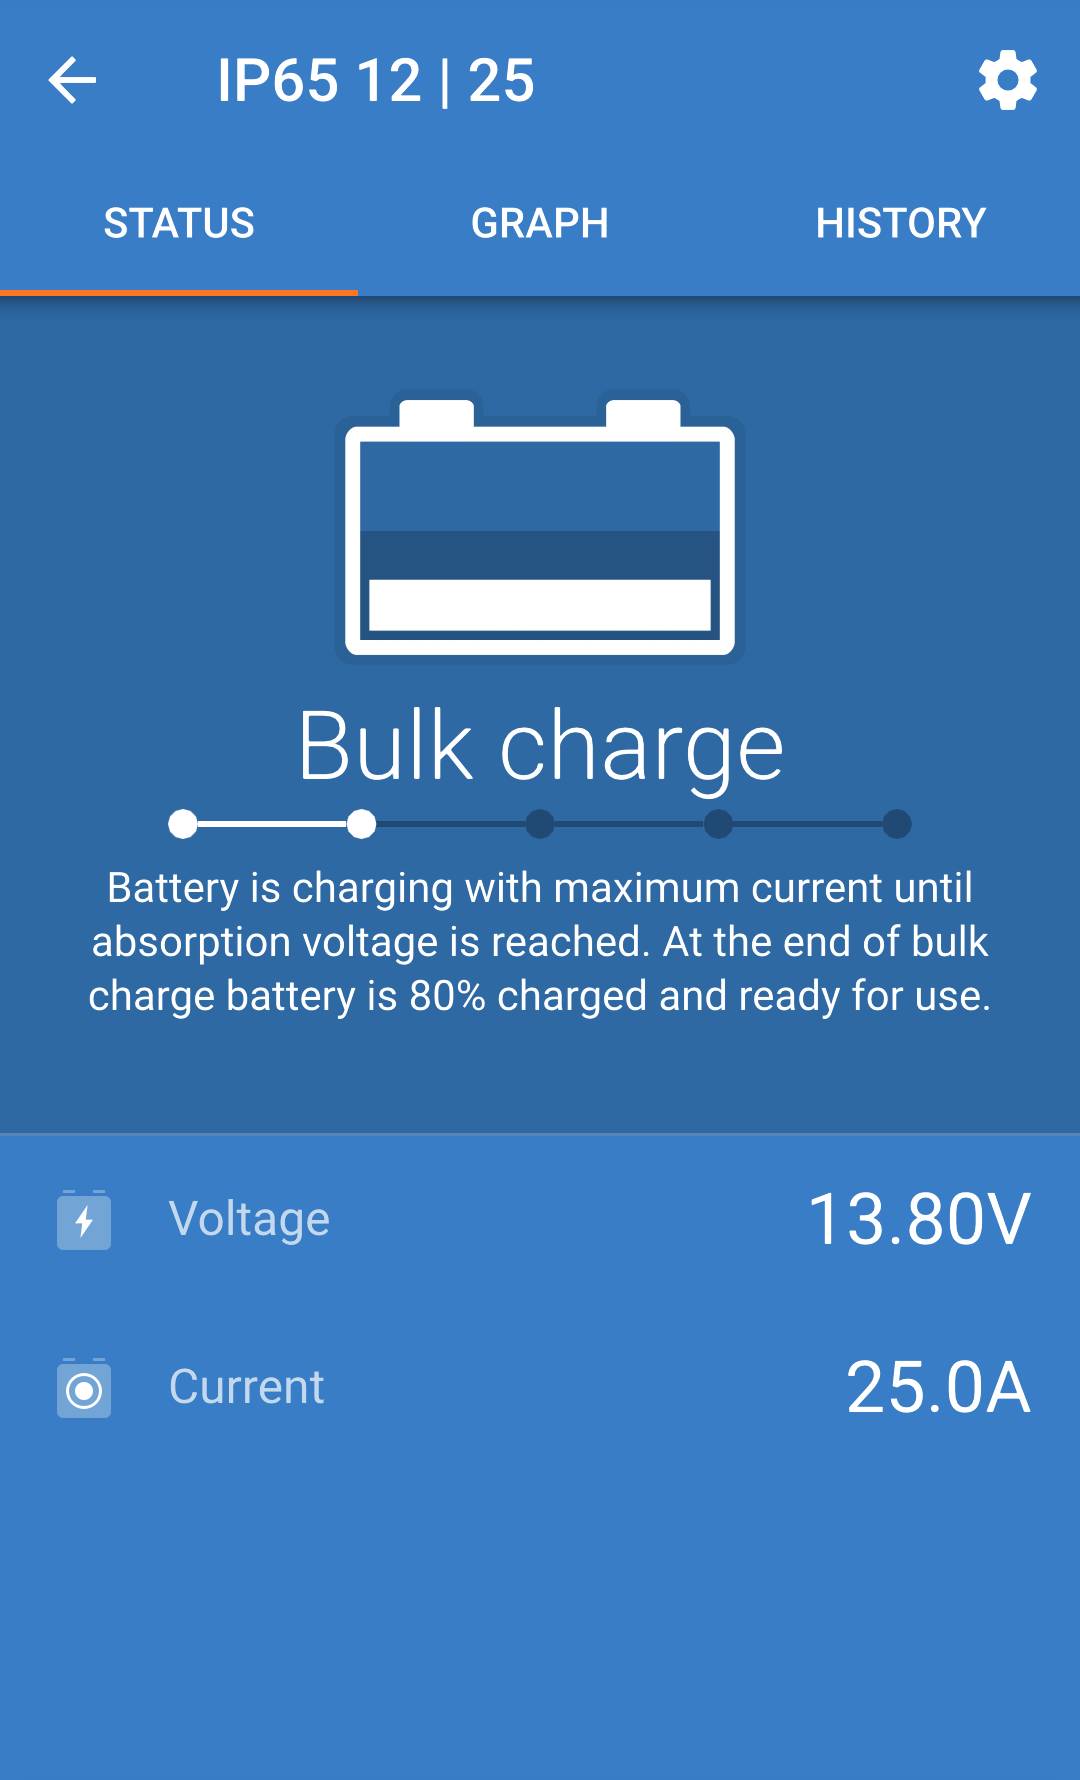
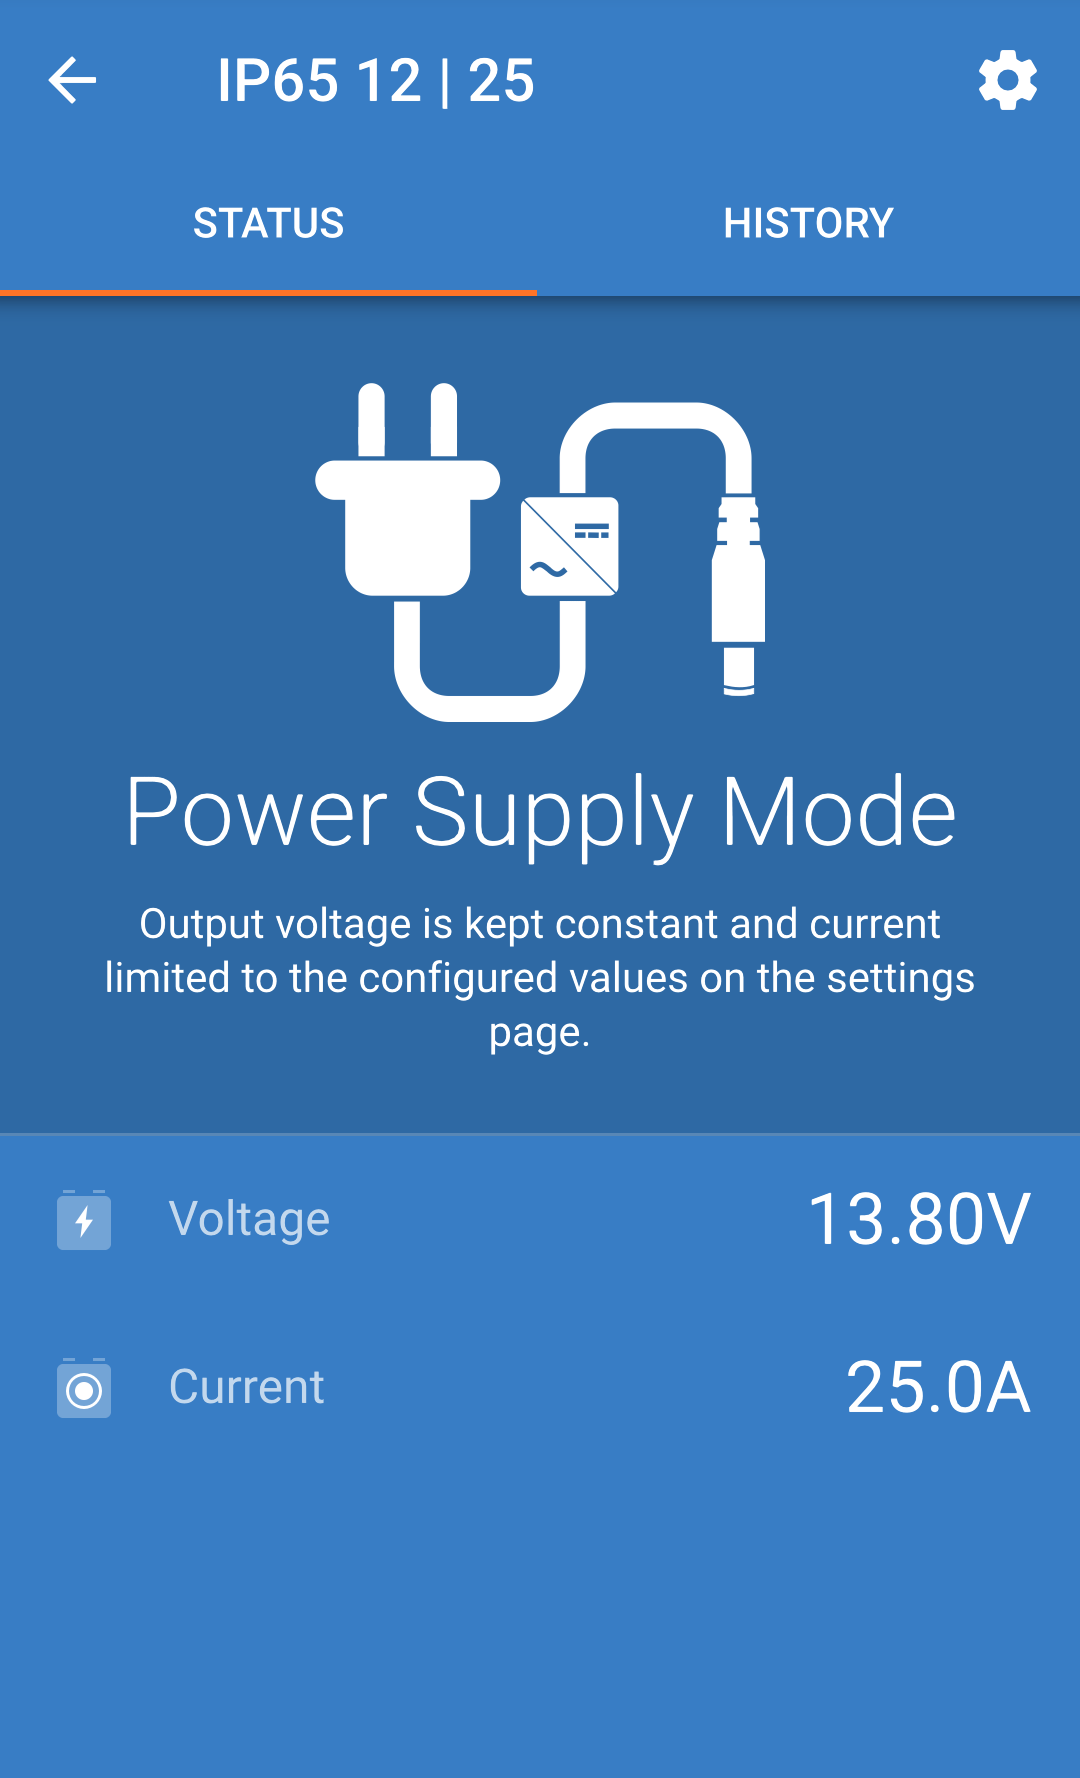
The STATUS screen is the main overview screen; it displays the battery voltage, the charge current and the active charge stage.
This data will update continuously and in real time as the charge cycle progresses.
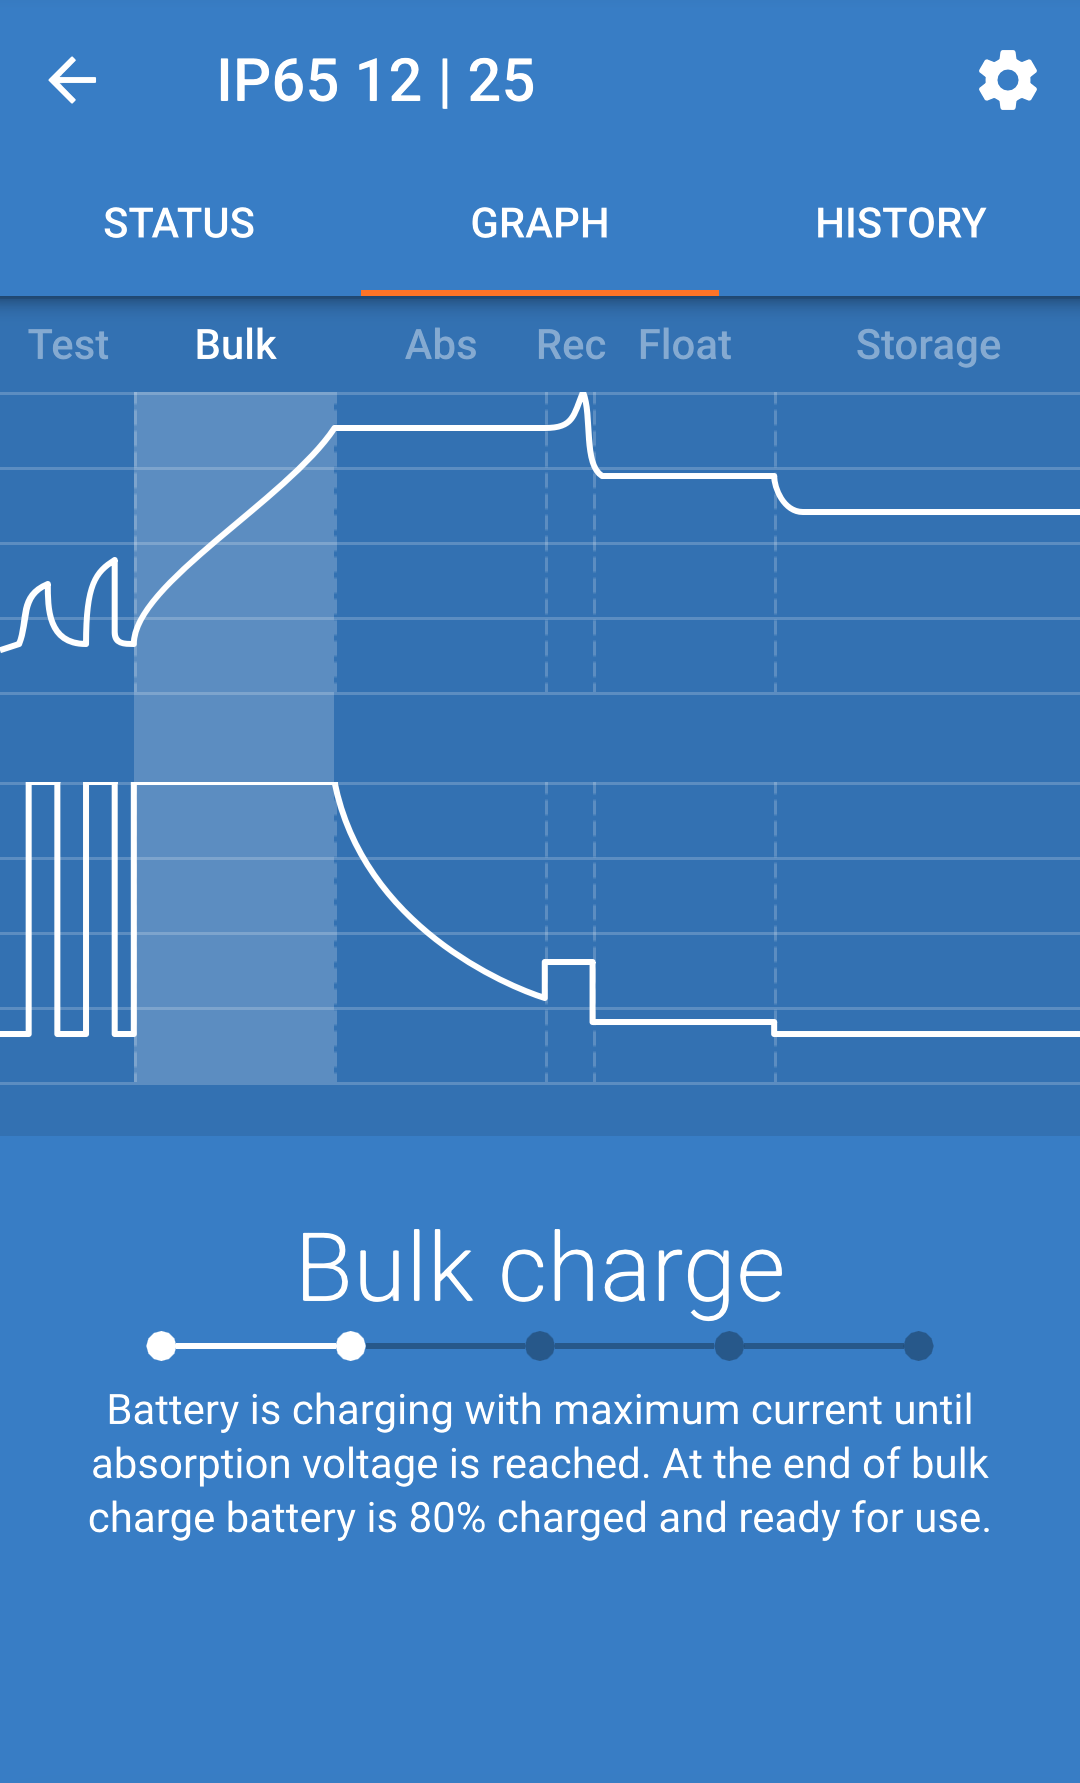
The GRAPH screen provides an easy to understand graphical representation of each charge stage with respect to battery voltage and charge current.
The active charge stage is also highlighted and stated below, along with a brief explanation.
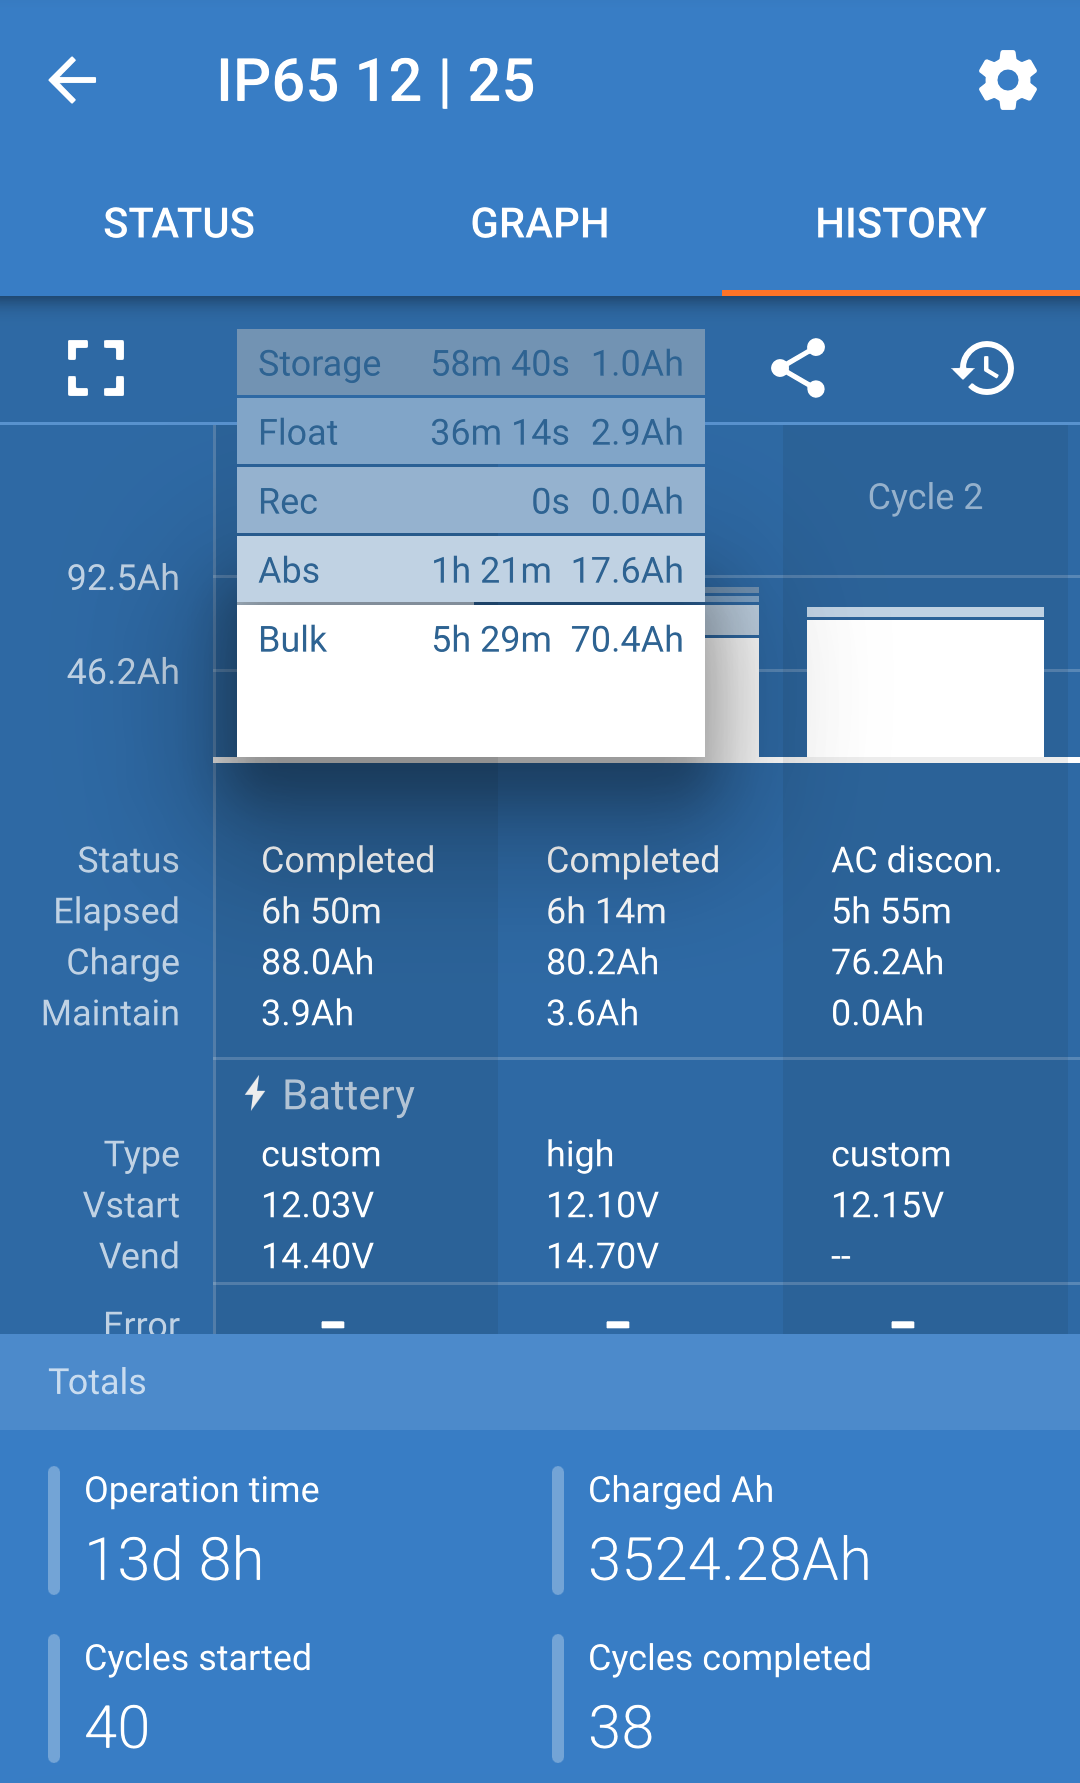
The HISTORY screen is a very powerful reference as it contains historical usage data over the charger’s lifetime and detailed statistics for the last 40 charge cycles (even if the charge cycle is only partially completed).
By selecting the full screen view the data is displayed in landscape view with significantly more days visible at the same time.
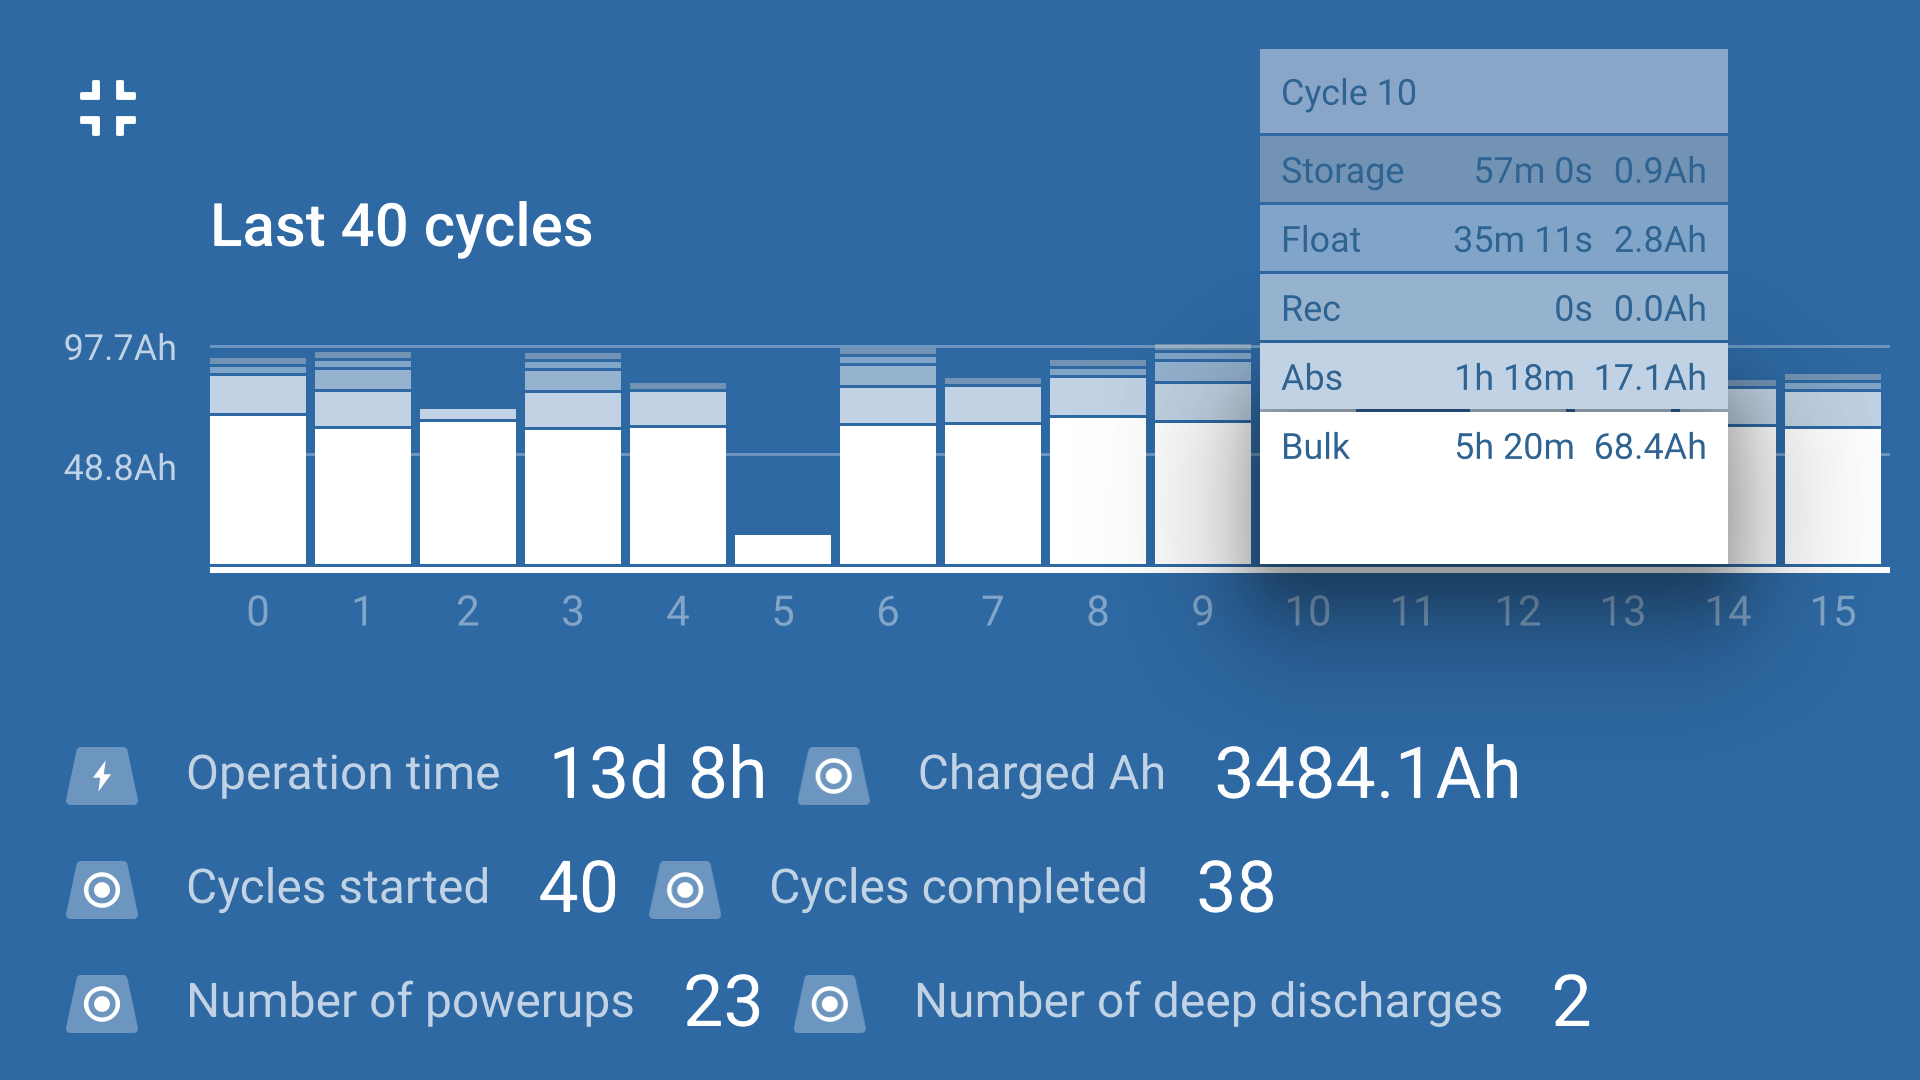
Charge cycle statistics
Cycle overview
Expandable bar chart showing the time spent in each charge stage and the charge capacity provided (in Ah) during each charge stage
Status
Confirms if the charge cycle was successfully completed or if it was ended early/interrupted for some reason, including the reason/cause
Elapsed
The elapsed/total charge cycle time
Charge
Total capacity provided during the recharge stages (Bulk and Absorption)
Maintain
Total capacity provided during the charge maintenance stages (Float, Storage and Refresh)
Type
The charge cycle mode used; either a ‘Built-in preset’ or a custom ‘Userdefined’ configuration
Vstart
Battery voltage when charging commences
Vend
Battery voltage when charging is complete (end of absorption stage)
Error
Displays if any errors occurred during the charge cycle, including the error number and description
Charger lifetime statistics
Operation Time
The total operation time over the lifetime of the charger
Charged Ah
The total charge capacity provided over the lifetime of the charger
Cycles started
The total charge cycles started over the lifetime of the charger
Cycles completed
The total charge cycles completed over the lifetime of the charger
Cycles completed %
The percentage of charge cycles completed over the lifetime of the charger
Number of power-ups
The number of times the charger has been powered up over the lifetime of the charger
Number of deep discharges
The number of times the charger has recharged a deeply discharged battery over the lifetime of the charger